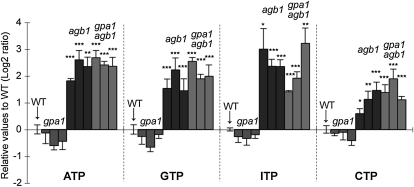
Figure 5.
Effects of nucleotides on [Ca2+]cyt response in heterotrimeric G protein mutant backgrounds. NTPs (100 μm) were applied to three independent aequorin lines in gpa1-4, agb1-2, and gpa1-4;agb1-2 mutant backgrounds. Histograms show means with se as relative values (log2 ratio) to the wild-type (WT) background control. Note that aequorin seedlings in agb1-2 and gpa1-4;agb1-2 backgrounds exhibited hyperresponsiveness to each of the nucleotides used. Mean [Ca2+]cyt values of wild-type controls were as follows: ATP, 2.1 ± 0.36 μm; GTP, 2.0 ± 0.22 μm; ITP, 1.3 ± 0.06 μm; CTP, 1.2 ± 0.06 μm. Asterisks indicate statistically significant differences compared with the wild-type aequorin control: * P < 0.05, ** 0.001 < P < 0.01, *** P < 0.001.

