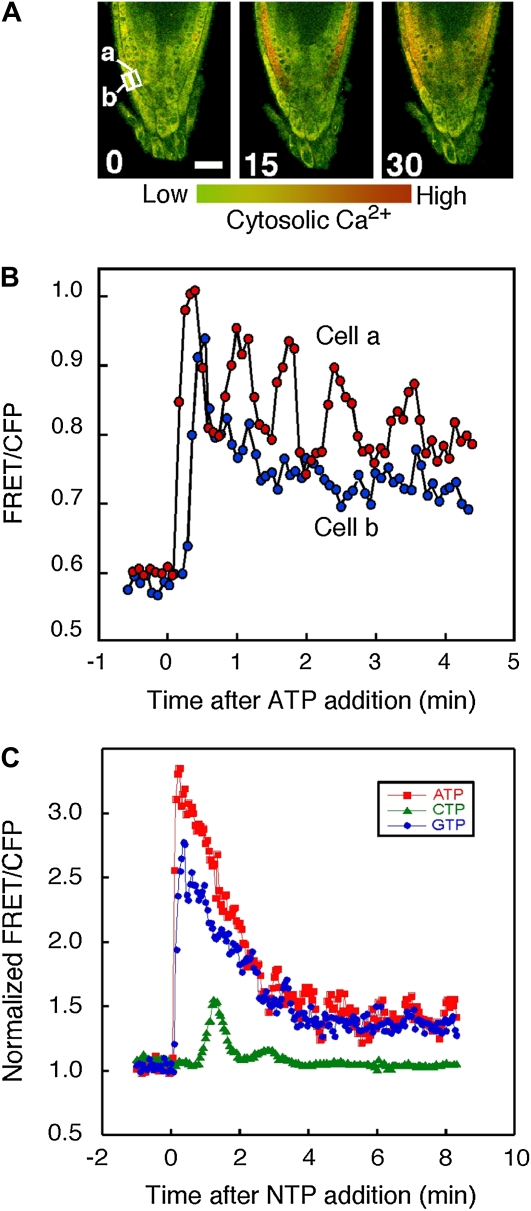
Figure 8.
Effects of NTPs on [Ca2+]cyt response in Arabidopsis seedlings monitored using YC3.6. Arabidopsis seedlings expressing YC3.6 were treated with 10 μm ATP, CTP, or GTP as indicated. Changes in [Ca2+]cyt were monitored at 5-s (A and B) or 3-s (C) intervals using confocal ratio imaging as described in “Materials and Methods.” [Ca2+]cyt has been pseudocolor coded according to the inset scale. Representative of five or more roots per treatment are shown. A, ATP-induced changes in [Ca2+]cyt imaged using YC3.6. Panels show time points in seconds following ATP treatment. Bar = 20 μm. B, ATP-induced changes in [Ca2+]cyt monitored in individual cells shown in A. C, NTP-induced changes in [Ca2+]cyt monitored in individual cell type a from A. CFP, Cyan fluorescent protein.

