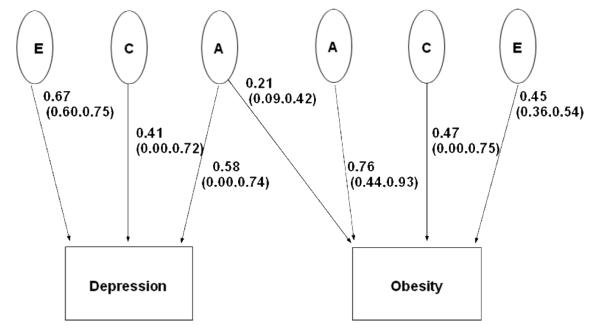
Figure 1.
Path diagram depicting additive genetic effects shared by depression and obesity plus additive genetic (A), common environmental (C), and unique environmental (E) effects unique to each trait. The parameter estimates and 95% confidence intervals are path coefficients, indicating the relative importance of the latent variables A, C, and E to depression and obesity.

