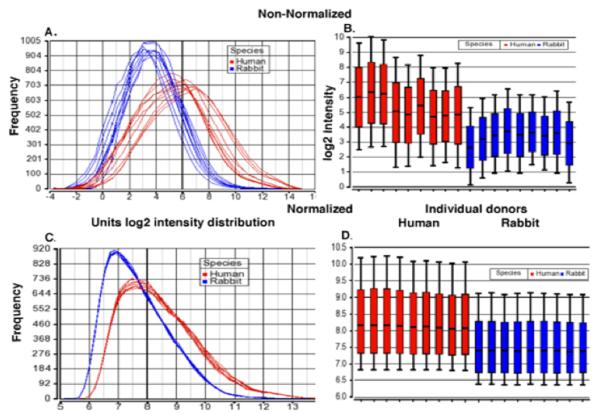
FIGURE 1.
Comparison of distribution of gene expression as measured with rabbit and human cRNA probes binding to human microarrays before and after dChip and within species normalization. A. and B. Non-normalized MAS5 probe set intensity distribution for log transformed gene expression of RNA isolated from 9 different PWBC samples from rabbit (blue) and 9 from human (red) on the Affymetrix huU95A array. C. and D. Following dChip summarization and within species normalization, rabbit samples average 0.7 fold dimmer. In panels B. and D., the middle lines show the median, the boxes represent 25th and 75th percentile of the data distribution, and whiskers representing 10% and 90% of the data distribution.

