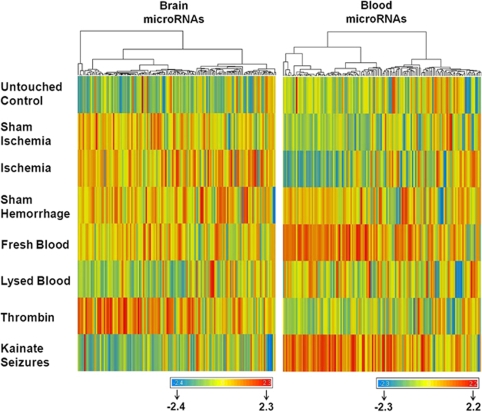
Figure 2.
Hierarchical clustering of miRNAs that changed more than 1.5-fold shows the unique miRNA expression profiles in brain (left panel) and blood (right panel) 24 h after each experimental condition. Red, upregulation; yellow, little change; and blue, downregulation. This experiment was performed on eight groups of rats including untouched controls (C), sham brain ischemia (SI), brain ischemia (I), sham brain hemorrhage (SH), fresh blood-induced brain hemorrhage (B), lysed blood-induced brain hemorrhage (LB), thrombin injections (T), and kainate seizures (K).

