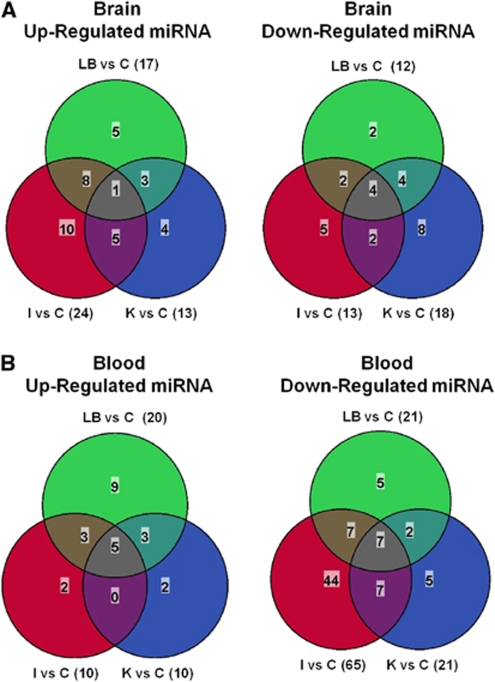
Figure 4.
Venn diagrams showing the numbers of miRNAs that were regulated more than twofold in brain and blood 24 h after brain ischemia (I), brain hemorrhage (LB, lysed blood), and kainate seizures (K) compared with untouched controls (C). (A) MicroRNAs upregulated (left panel) and downregulated (right panel) in the brain. (B) MicroRNAs upregulated (left panel) and downregulated (right panel) in blood.

