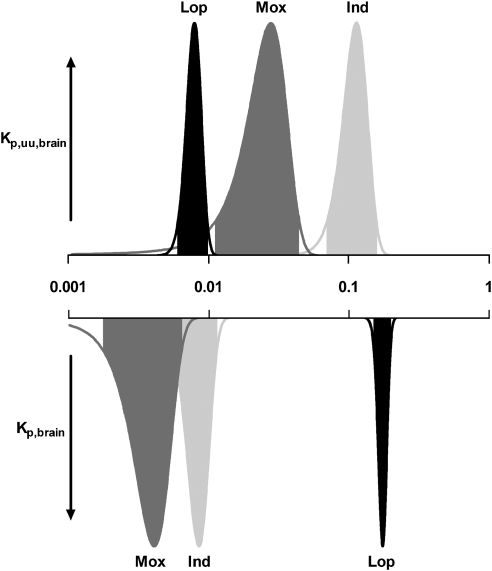
Figure 2.
Probability density graph for Kp,uu,brain (upward) and Kp,brain (downward) for indomethacin (Ind), loperamide (Lop) and moxalactam (Mox) in a representative rat (Rat 4). The shaded areas define the 95% confidence intervals. The shift on the log scale for the peak of Kp,brain and Kp,uu,brain corresponds to the pattern of binding to plasma proteins and brain tissue (Vu,brain × fu,p) for each drug (Table 3).

