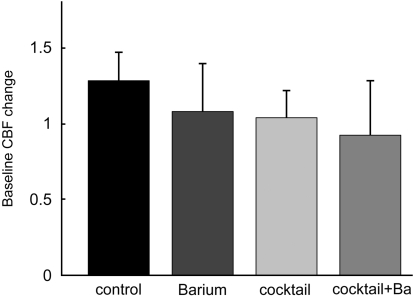
Figure 2.
Baseline CBF changes. The relative changes in baseline CBF were calculated as the ratio of the mean of all CBF data of the first block (superfusion of aCSF in all groups) to the mean of all CBF data of the second block (superfusion of aCSF+vehicle in the control group, superfusion aCSF+inhibitors for the other groups). Baseline CBF increased by 28%±19% in the control group. In comparison with the control group, baseline CBF was reduced by approximately 20% in all other groups, with a nonsignificant trend towards stronger reduction in the cocktail plus BaCl2 group. Error bars denote 95% confidence intervals.

