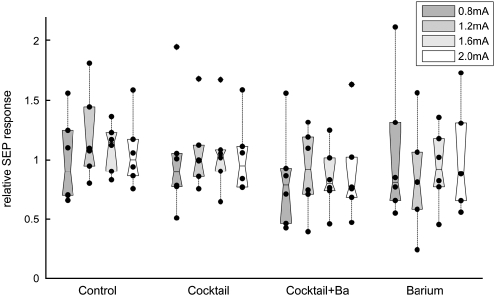
Figure 3.
SEP responses. The SEP amplitudes were calculated as amplitude between the first negative and positive peak (N1P1). Average amplitudes of the first stimulation block were divided by average amplitudes of the second block (after superfusion of vehicle/inhibitors) for each stimulation intensity. The figure shows the relative changes in SEP amplitude after superfusion of vehicle/inhibitors; black dots denote individual animals and boxes contain the second and third quartiles. There is no significant change in the SEP amplitudes, although a trend towards small reduction can be seen with the cocktail+BaCl2 and BaCl2 groups.

