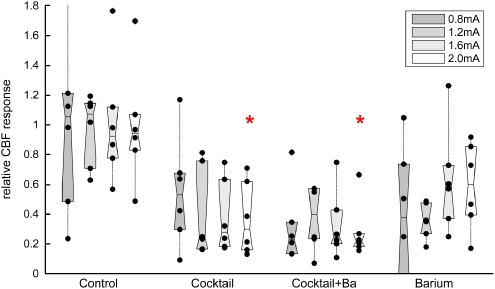
Figure 6.
CBF responses pharmacologically reduced. The relative changes in activity-induced increase in CBF were calculated by individually dividing the average CBF increases of all animals of each group before by the average CBF increase after superfusion of vehicle/inhibitors. Black dots denote individual animals and boxes contain the second and third quartiles. CBF responses were largely reduced to 30% to 40% of the baseline response in the cocktail and cocktail+BaCl2 group. BaCl2 alone led to less pronounced reductions in CBF response. CBF response reduction was statistically tested for the 2.0-mA stimulation intensity. The red stars denote significant differences compared with the control group.

