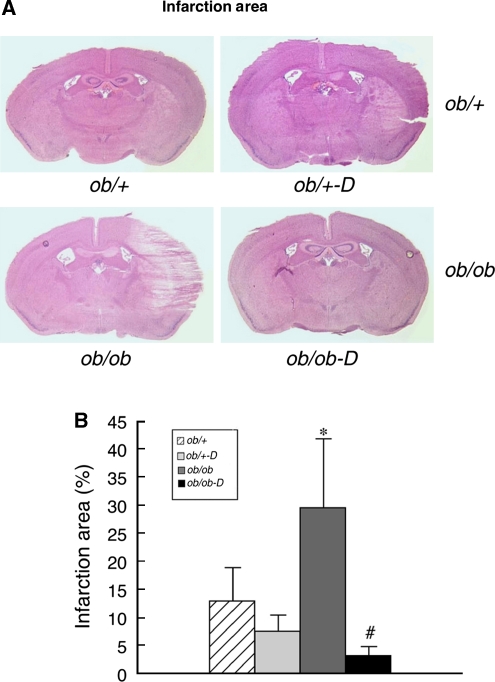
Figure 3.
Effects of darglitazone on the infarct area. (A) Representative hematoxylin and eosin (H&E) stained 16 μm cryosections from control and diabetic, treated and untreated, mice at 24 h of recovery from hypoxia–ischemia (H/I). (B) Sections from all animals were analyzed by Scion Image and the results calculated as the area of infarction as a percentage of the ipsilateral hemisphere relative to the contralateral hemisphere; mean±s.e.m. (n=6 to 8 per group). *P<0.05 versus ob/+ (effect of gene) and #P<0.05 versus darglitazone (D) treatment (effect of drug).  , ob/+
  , ob/+-D;
  , ob/ob; ▪, ob/ob-D.

