Figure 4.
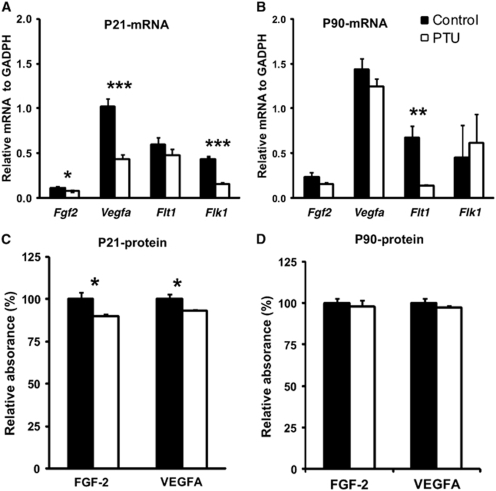
In vivo analysis of relative levels of FGF-2 (basic fibroblast growth factor) and VEGF-A (vascular endothelial growth factor A) in the cortex. Tissue was collected during PTU treatment (P21) and after PTU treatment (P90). The relative mRNA levels of Fgf2, Vegfa and Flk1 (VEGFR-2) were reduced at P21 (A), but recovered to normal levels by P90 (B), as measured by Q-PCR. Flt1 (VEGFR-1) mRNA levels remained unchanged at P21, but decreased by P90 (panels A and B). The relative amount of protein expression of FGF-2 and VEGF-A were reduced at P21 (panel C), but recovered to normal levels by P90 (panel D). Data represent mean±s.e.m. from P21 (n=4) and P90 rats (n=6, 3 male and 3 female). Two-sample equal variances t-test was applied, ***P<0.001, **P<0.01, *P<0.05.

