Figure 5.
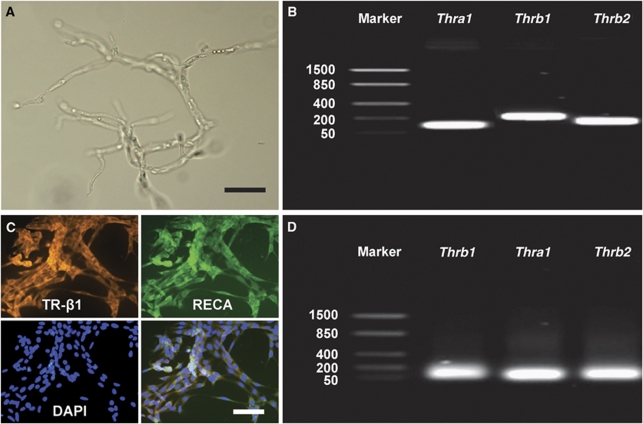
Thyroid hormone receptor (TR) expression in microvessels of the cortex and REB4 cells. (A) Purely isolated microvessels from the rat cortex. (B) TR expression in isolated microvessels determined by RT-PCR. (C) Immunohistochemistry staining of RBE4 cells against TR-β1 (orange signal) and RECA (green signal) revealed intense expression by endothelial cells (DAPI nuclear staining in blue). Immunostaining against TR-α1 and TR-β2 obtained similar results (data not shown). (D) TR expression in RBE4 cells determined by RT-PCR. Scale bar in panel A=250 μm and in panel C=25 μm.

