Figure 7.
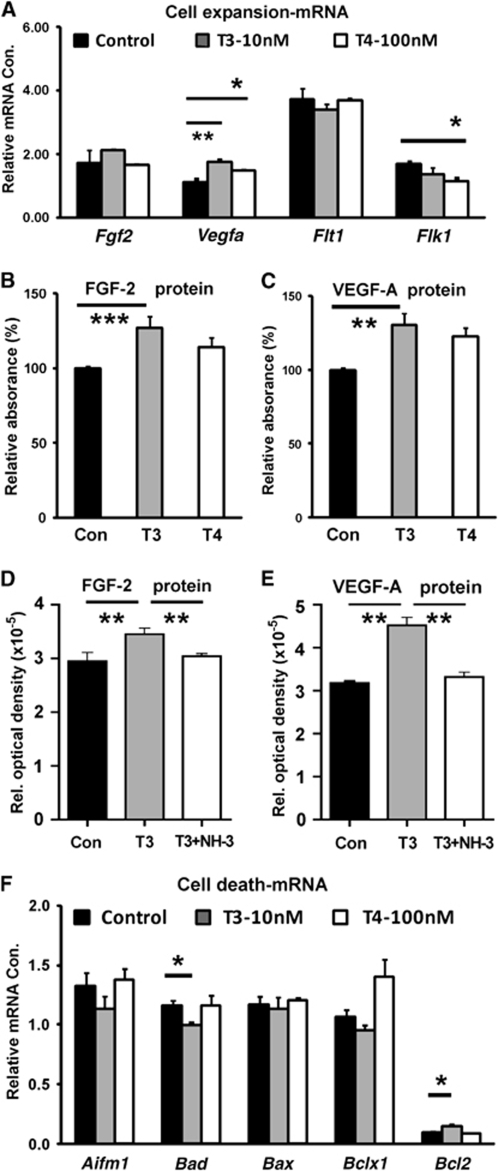
Expression of FGF-2 and VEGF-A, as well as apoptosis-related genes, during in vitro cell expansion. T3 (10 nmol/L) and T4 (100 nmol/L) increased the relative levels of Vegfa mRNA expression, but T3 decreased Flk1 (VEGFR-2) mRNA expression (A). T3 treatment increased the relative amounts of FGF-2 (B) and VEGF-A (C) protein expression, but T4 had no effect. (D and E) Protein levels of FGF-2 and VEGF-A were normalized by adding thyroid hormone receptor blocker NH-3. (F) T3 treatment increased mRNA expression of the antiapoptotic gene Bcl2, but reduced mRNA expression of the proapoptotic gene Bad. Cell assay results were expressed as percentage of control and were repeated three independent times. Two-sample equal variances t-test was used in panels A, B, C and F and ANOVA in panels D and E, ***P<0.001, **P<0.01, *P<0.05.

