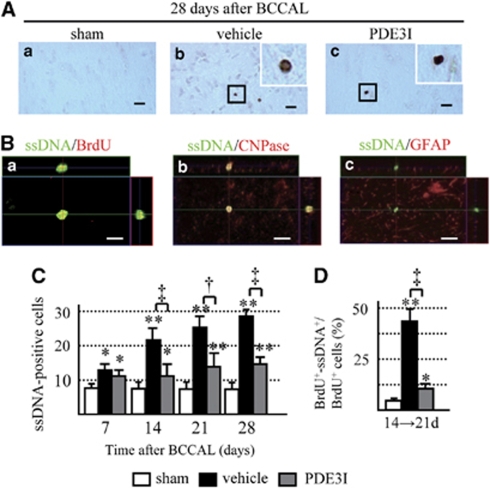
Figure 5.
(A) Photomicrographs showing ssDNA staining in the white matter of sham (a), vehicle (b)-, and PDE3I (c)-treated rats 28 days after BCCAL. Bar=20 μm. Insets in b and c: magnified views. Magnification, × 400. (B) Colocalization of ssDNA-positive cells in the vehicle group at days 14 → 21 after BCCAL. (C) Number of ssDNA-positive cells. Double immunofluorescence BrdU staining (red (a)), CNPase (red (b)), GFAP (red (c)), and ssDNA (green (a–c)). Bar=10 μm. (D) Percentage of BrdU/ssDNA-double-positive cells relative to BrdU-positive cells. BrdU+: BrdU-positive cells, ssDNA+: ssDNA-positive cells. Data in panels B and D are mean±s.e.m. of 5 rats in each group. *P<0.05, **P<0.001, compared with sham-operated group; †P<0.05, ‡P<0.001, compared with vehicle group.

