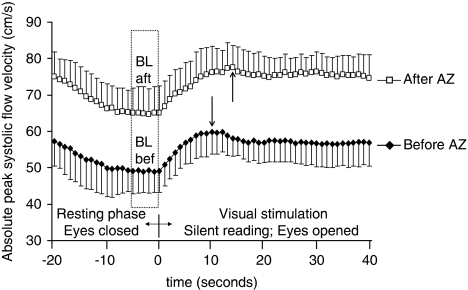
Figure 3.
Absolute peak systolic flow velocity time courses, measured during the visually evoked flow tests, before and after AZ administration. Observe the higher peak systolic flow velocity data after AZ administration. Significant increase of peak systolic flow velocities were induced by visual stimulation either before or after AZ administration. The arrows indicate the time of maximum peak systolic flow velocity during visual stimulation before (11 secs) and after (15 secs) AZ administration. Error bars indicate s.d. (The baseline was calculated from the blood flow velocities averaged for a time span of 5 secs at the end of the resting phase before /BLbef/, or after /BLaft / AZ administration.)

