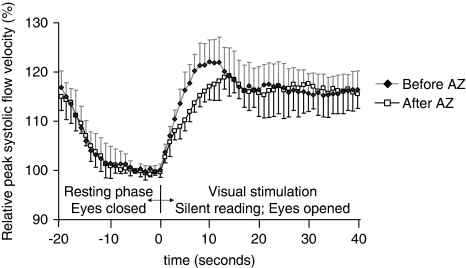
Figure 4.
Relative peak systolic flow velocity time courses, measured during the visually evoked flow tests, before and after AZ administration. Relative flow velocities were calculated in relation to the proper baseline value (baseline before /BLbef/ or after AZ /BLaft/). Repeated-measures ANOVA did not detect significant group (i.e., before and after AZ) main effect between the relative flow velocities during visual stimulation before and after AZ provocation. Error bars indicate s.d.

