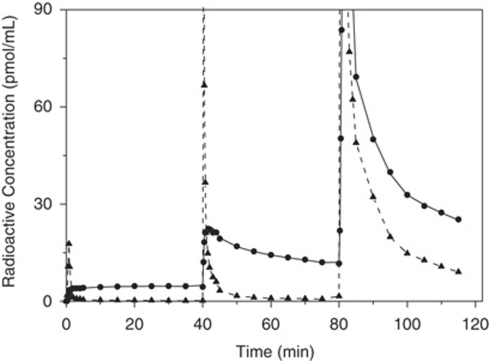
Figure 2.
Plasma and PET time–activity curves obtained in frontal cortex in baboon using a multi-injection protocol. Shown is the input function (plasma unchanged befloxatone, triangle and dashed line); the experimental PET data (circles symbols); and the simulated curve obtained from the estimated model parameters (solid line). The y axis has been truncated at 90 pmol/mL for a better visualization of the plasma curve.

