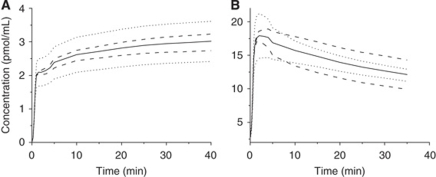
Figure 4.
Simulations of changes in cerebral blood flow and receptor concentration. Solid lines show the PET time–concentration curves simulated in the frontal cortex after a tracer injection (A) and a low SA injection (B) corresponding respectively to the first and the second injections of the experiment 1. Simulations are obtained with the same model parameters, except for the receptor concentration (dashed lines) or the parameter k1 (dotted lines), which were increased or reduced by 20%.

