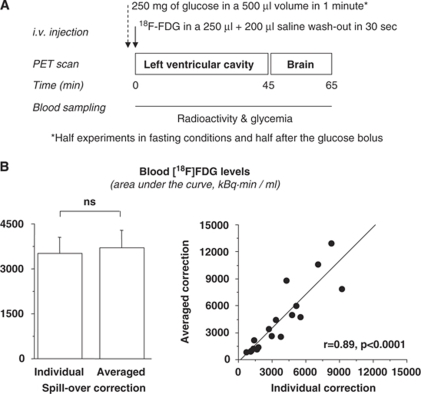
Figure 1.
(A) Design of a positron emission tomography (PET) study session. (B) Areas under the blood tracer concentration curve (input function) after correcting for individually measured or averaged spillover fractions in 20 animals undergoing frequent blood sampling, showing no difference (left) and a tight correlation (right) between the two methods.

