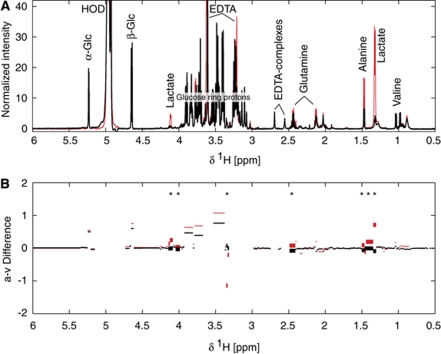
Figure 2.
NMR spectra (A) of arterial blood plasma sampled at rest (black) and at exhaustion (red). Median values (B) of the differences between integrated spectra of arterial and venous plasma (AV-difference) at rest (black) and at exhaustion (red). Significant differences between the medians, P<0.05 (Wilcoxon-rank sum test), are marked with stars and thicker lines. The NMR spectra were normalized to the externally determined concentration of glucose in the plasma samples.

