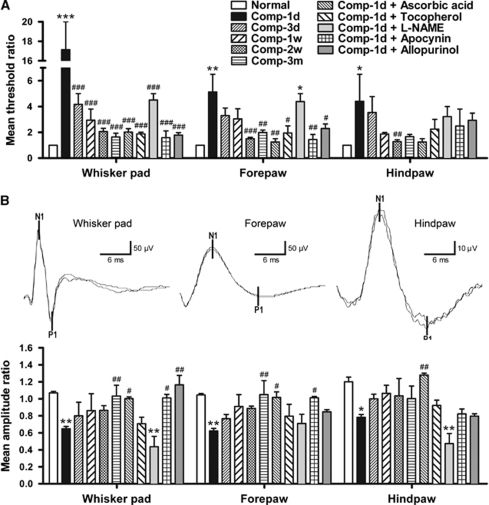
Figure 2.
Time-dependent changes in the mean threshold ratios of the von Frey behavioral test (A) and the mean amplitude ratios of the somatosensory evoked potentials (SSEPs) (B) from normal animals and animals subjected to compression of the right somatosensory cortices. The upper panels in B were example SSEP waveforms recorded from a normal animal. The N1-P1 component was used to analyze the peak-to-peak amplitude. Mean±s.e.m., n=4 per group, d=day, w=week, m=month. *P<0.05, **P<0.01, ***P<0.001, compared with each corresponding normal; #P<0.05, ##P<0.01, ###P<0.001, compared with each corresponding animal group surviving for 1 day after compression (Comp-1d).

