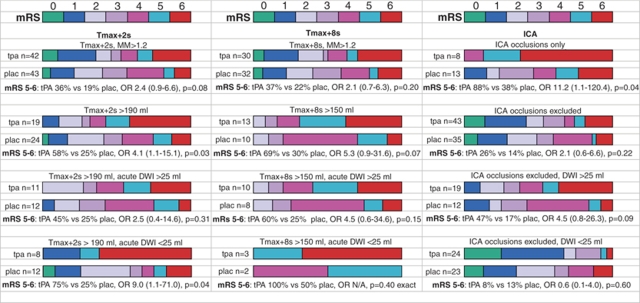
Figure 2.
Graphic comparison of the modified Rankin Scale for tPA versus placebo patients fulfilling various PWI, DWI, and ICA occlusion criteria for poor outcomes. Below the graphs for each cut point are the odds ratio (OR) for tPA versus placebo for poor (mRS: 5 to 6) outcomes. MM, mismatch ratio. 95% confidence intervals are displayed in brackets beside the odds ratio.

