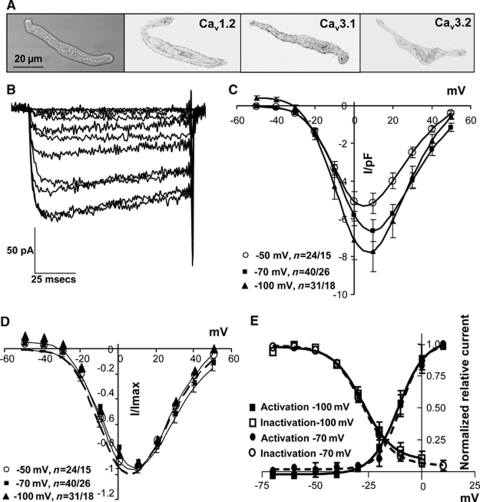
Figure 3.
Voltage-dependent calcium currents in cerebrovascular SMCs. (A) Isolated SMCs were spindle-shaped and expressed L- and T-type channels (CaV1.2 and 3.1) with reduced CaV3.2 expression. Immunohistochemistry images were converted to black on white. (B) Ba2+ currents evoked from a holding potential of −70 mV with incremental 10 mV depolarizing steps between −50 and +50 mV. (C, D) Group data for currents evoked from −50, −70, and −100 mV, normalized to cell capacitance (C) or peak current (D). (E) Activation and inactivation curves from −70 and −100 mV. n=number of cells/animals.

