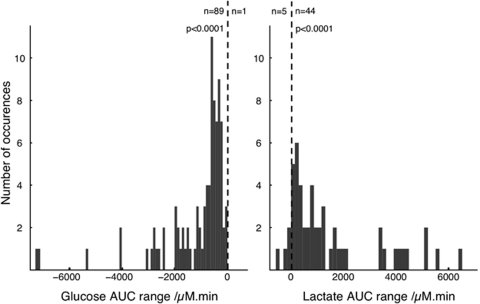
Figure 4.
The AUC distribution for the glucose and the lactate events observed in the rsMD data. The AUC for each rsMD epoch was calculated for 20 mins after SD. The distribution for all the glucose events across the nine patients is shown on the left panel and the distribution for all lactate events on the right. The dotted vertical line specifies the zero-AUC. The number of epochs with a negative AUC is indicated on the left of this line and the number of epochs with positive AUC is indicated on the right for glucose and lactate, respectively. The P-value results from a Binomial test with the expectation of a 50% distribution of positive and negative AUCs.

