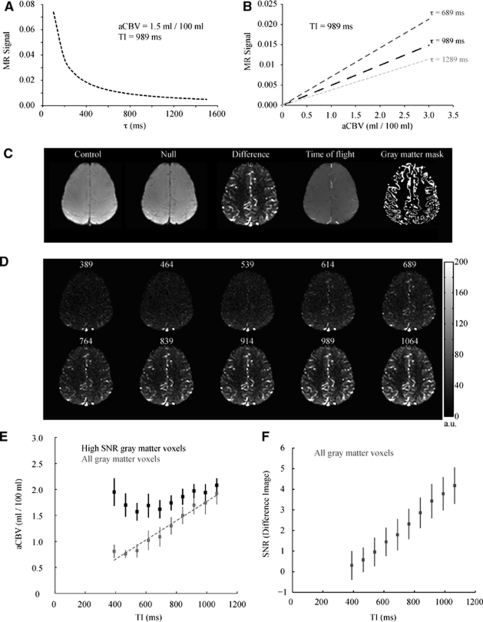
Figure 2.
Methodological study. Simulations demonstrating the effect of capillary arrival time (τ) and aCBV on iVASO-DS MR signal. (A) iVASO-DS signal versus τ for aCBV=1.5 mL/100 mL and TI=989 ms. MR signal is large for short τ but reduces at long τ. (B) iVASO-DS signal versus aCBV for three possible τ times. The simulations assume TI=989 ms. The signal is linear with aCBV, suggesting that an iVASO-DS image alone is proportional to aCBV. (C) Left to right: a representative control, null, difference, time-of-flight, and gray matter mask obtained from the methodological experiment. Voxels within the GM mask were used for aCBV quantification. (D) iVASO-DS CBVw images for varying TI (range 389 to 1,064 ms). The TR was adjusted to keep steady-state blood water nulled (see Table 1). (E) Gray matter aCBV as a function of TI. The gray data points represent all GM voxels and the line is the best fit line to these points. The measured aCBV is approximately linear with TI for the approximate range of capillary arrival times. The black data points show the measured aCBV for voxels with high SNR only. (F) The SNR of the iVASO-DS difference image as a function of TI.

