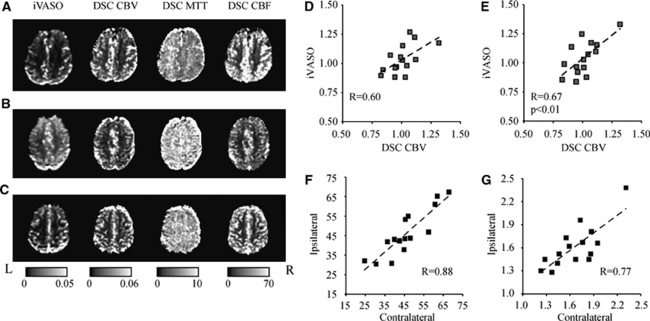
Figure 3.
Representative iVASO difference images and DSC-computed CBV, MTT, and CBF maps for three representative patients: PT8 (A), PT16 (B), and PT6 (C); see Table 3 for patient details and symptoms. Contralateral:ipsilateral (to maximum ICA stenosis burden) iVASO ratios are plotted against DSC-CBV ratios before (D) and after (E) MTT correction. Ipsilateral versus contralateral CBF (F) and iVASO aCBV (G) reveal a higher hemispheric correlation for CBF (R=0.88) compared with iVASO-measured aCBV (R=0.77) in patients.

