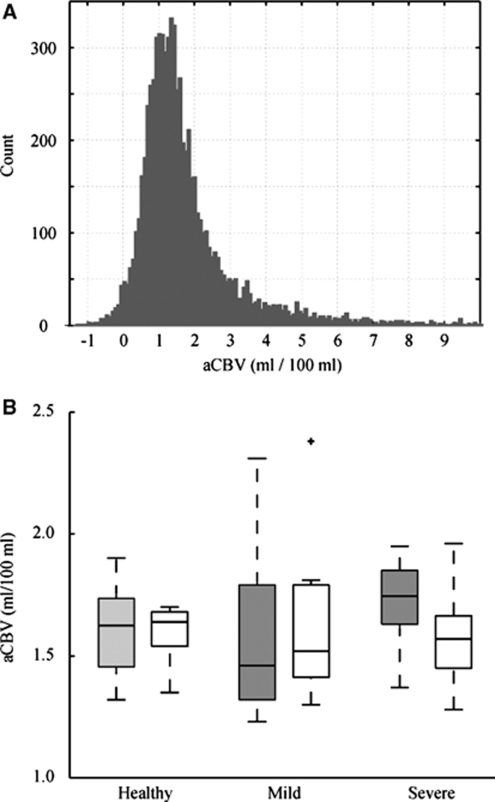
Figure 4.
(A) Histogram of all GM aCBV values for the healthy control group. (B) Box plots of iVASO aCBV for the healthy control (left), mild stenosis (middle), and severe stenosis (right) volunteers. Gray is right in controls and contralateral to maximum stenosis burden in patients. White is left in controls and ipsilateral to maximum stenosis burden in patients. The central black line is the group median, the edges of the boxes are the 25th and 75th percentiles, the whiskers extend to the most extreme data points and any statistically significant outliers are plotted as black crosses.

