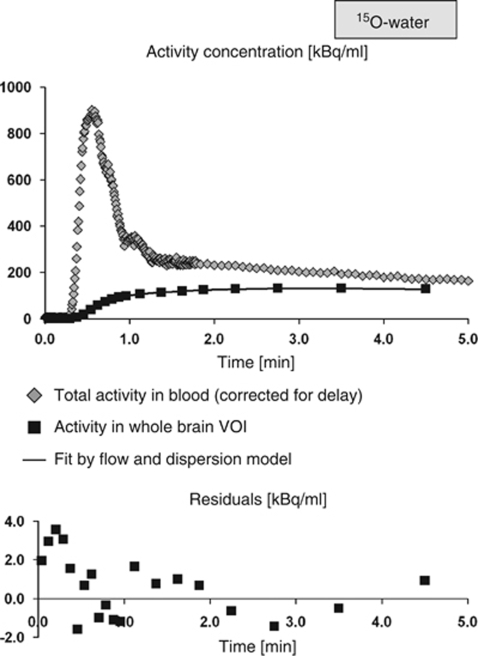
Figure 3.
15O-water TACs in one representative subject (Ishak score 2). The upper part of the figure shows the delay corrected 15O-water activity in blood (input function), the TAC in the whole brain VOI, and the fit by the flow and dispersion model. The lower part of the figure shows the residuals of the fit (note the different scaling of the y axis, the residuals are of the order of 1%). The perfusion was estimated to 0.291 mL/mL/min (coefficient of variance 2.5%). 13N-ammonia TACs of this subject are shown in Figure 4.

