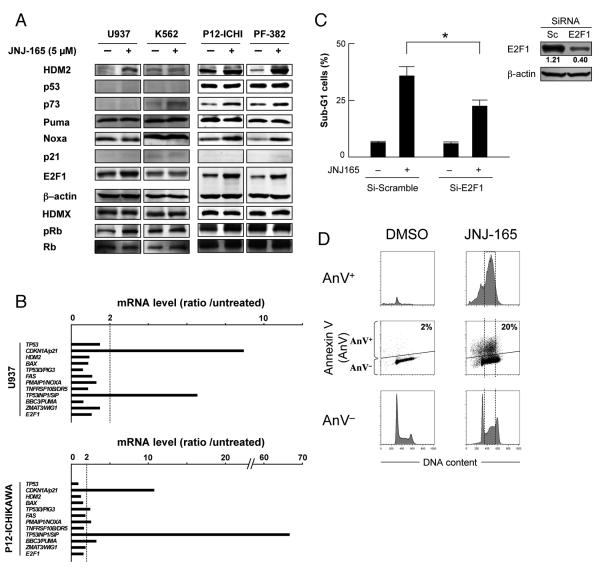
Figure 5. JNJ-26854165 induces E2F1-mediated apoptosis in p53 mutant cells.
(A) Protein expression in p53 mutant acute leukemia cells, treated with 5 μM JNJ-26854165 for 48 hours. β-actin was used to confirm equal loading of proteins. (B) Gene activation profiles after 48-hour treatement with 5 μM JNJ-26854165 in U937 and P12-ICHIKAWA cells. Ratios represent JNJ-26854165 values divided by control values. Each value represents the mean of two independent experiments (each assayed in duplicate). (C) U937 cells were transfected with either control (Si-Scramble) or E2F1 siRNA (Si-E2F1) and incubated for 24 hours before the addition of 10 μM JNJ-26854165. After additional 72 hours incubation, DNA content was analyzed by flow cytometry and percentages of cells in sub-G1 population were determined. Intensity of the immunoblot signals was quantified by densitometry using NIH ImageJ 1.38 software, and the relative intensity of E2F1 compared to β-actin was calculated. Asterisk (*) indicates significance at P < .05. (D) JNJ-26854165 induced p53-independent apoptosis predominantly in S-phase cells. P12-ICHIKAWA cells which showed the highest ratio between the percentage of dead cells in JNJ-26854165-treated and untreated cultures among p53 mutant cell lines (see Fig. 1A), were treated with 5 μM JNJ-26854165 for 72 hours, and stained for DNA content. The Annexin V-positive fractions in correlation with DNA content were measured by flow cytometry. Data were gated on the FL2-area versus FL2-width cytogram to exclude doublets. Cells were gated on dot plots (middle row), based on Annexin staining. Annexin V-positive fraction (AnV+) corresponds to apoptotic cells, while Annexin V-negative fraction (AnV−) to viable cells. Histograms indicate the distribution of DNA content in the gated populations (AnV+: upper row, or AnV−: lower row) of the preceding dot plots. Results are representative of three independent experiments.

