
Figure. Gram-negative bacilli colonization and blood stream infection by week of life.
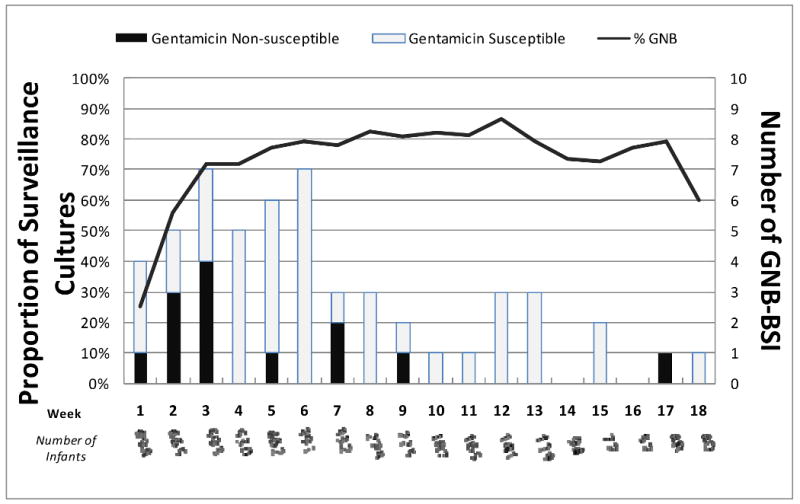
The left hand Y-axis shows the proportion of infants colonized with GNB and the right hand Y-axis shows the number of GNB BSIs during the first 18 weeks of life. The X-axis represents the week of life and shows the number of infants remaining in the study NICUs each week. Gentamicin-susceptible and gentamicin-non-susceptible BSIs are shown. Five BSIs occurred after the 18th week of life and are not shown in the Figure.