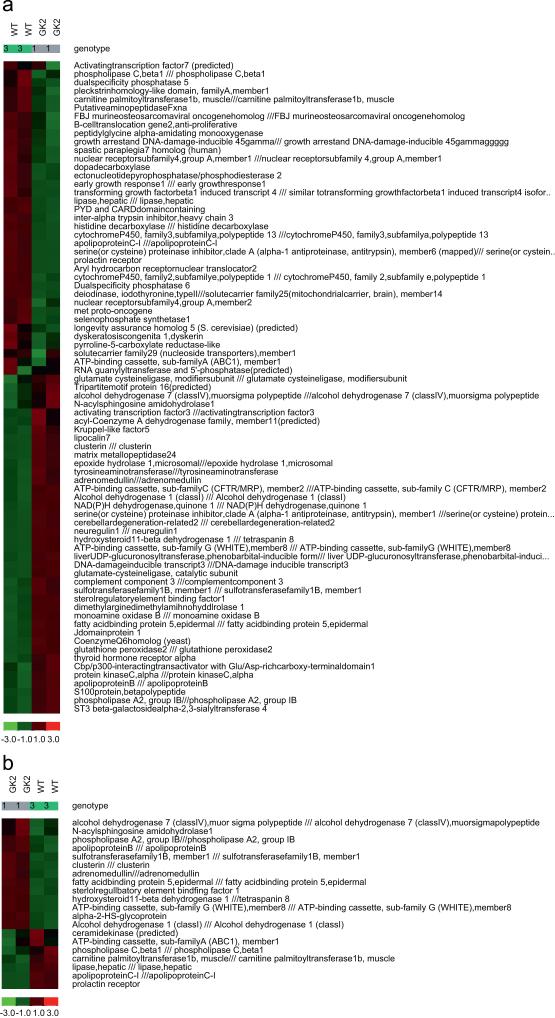
Figure 2. Supervised hierarchical clustering “heat map” of the wild type (WT) and GK-overexpressing cell line (GK2).
(a) Genes involved in cellular metabolic processes. (b) Genes involved in lipid metabolic processes and lipid transport. Genes were filtered by using the following criteria: absolute fold change > 1.5, absolute difference in expression level > 100, p < 0.05, present call > 20%. Genes with incomplete annotations (“transcribed locus” or “similar to another gene”) were omitted. The two biological replicates of each cell line are shown separately. Red color indicates upregulation and green indicates downregulation, as denoted by the color bars below each panel.

