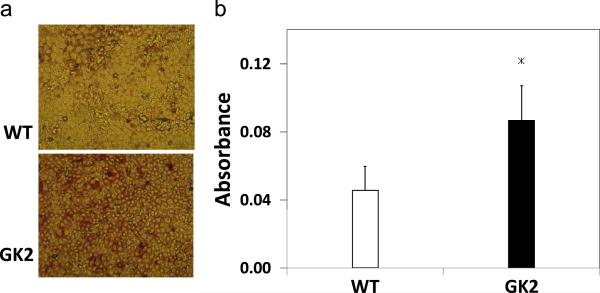
Figure 4. Lipid visualization and quantification by Oil Red O staining.
Wild type (WT) and GK-overexpressing (GK2) cells were treated with Oil Red O as described in Methods. (a) Cells after Oil Red O treatment, sample region from 10 cm plate. Intensity of red color is proportional to lipid accumulation. (b) Absorbance of Oil Red O (at 510 nm) averaged throughout a 10 cm plate. Significant differences are indicated “*” (p<0.01).

