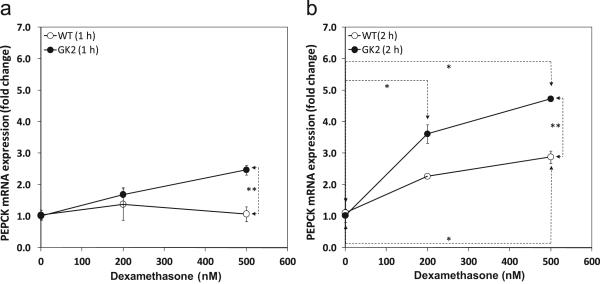
Figure 6. GK-overexpressing cell line GK2 has higher GR transcription factor activity than the wild type (WT).
WT (open circles) and GK2 (filled circles) cell lines were assayed for glucocorticoid receptor transcription factor activity by measuring the expression level of known GR-responsive gene PEPCK to glucocorticoid agonist dexamethasone for (a) 1 h and (b) 2 h. Gene expression levels are relative to dexamethasone-untreated controls (0 nM) for the same line. ‘*’ indicates p < 0.05 between different dexamethasone dosages on the same cell line. ‘**’ indicates p < 0.05 between lines GK2 and WT for the same dexamethasone dosage. Gene expression was assayed by quantitative RT-PCR, as described in Methods.

