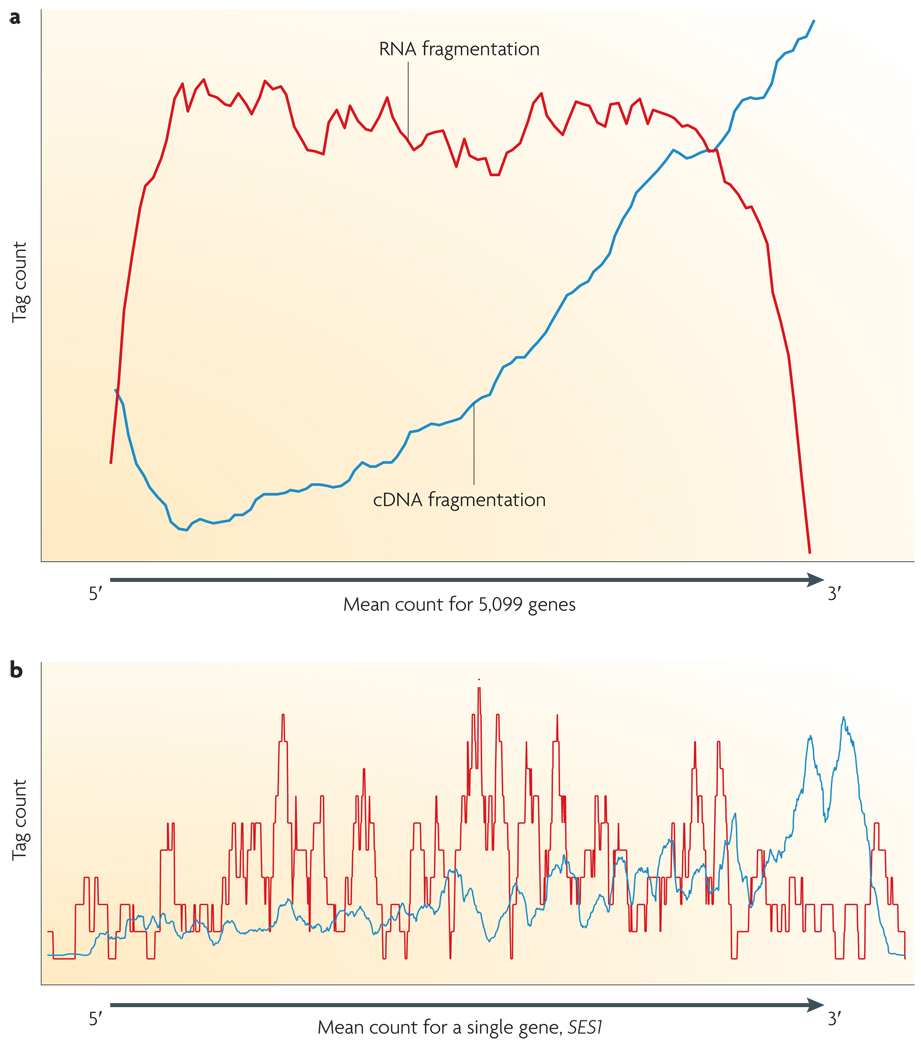
Figure 3. DNA library preparation: RNA fragmentation and DNA fragmentation compared.
a | Fragmentation of oligo-dT primed cDNA (blue line) is more biased towards the 3′ end of the transcript. RNA fragmentation (red line) provides more even coverage along the gene body, but is relatively depleted for both the 5′ and 3′ ends. Note that the ratio between the maximum and minimum expression level (or the dynamic range) for microarrays is 44, for RNA-Seq it is 9,560. The tag count is the average sequencing coverage for 5,000 yeast ORFs18. b | A specific yeast gene, SES1 (seryl-tRNA synthetase), is shown.

