
Figure 1.
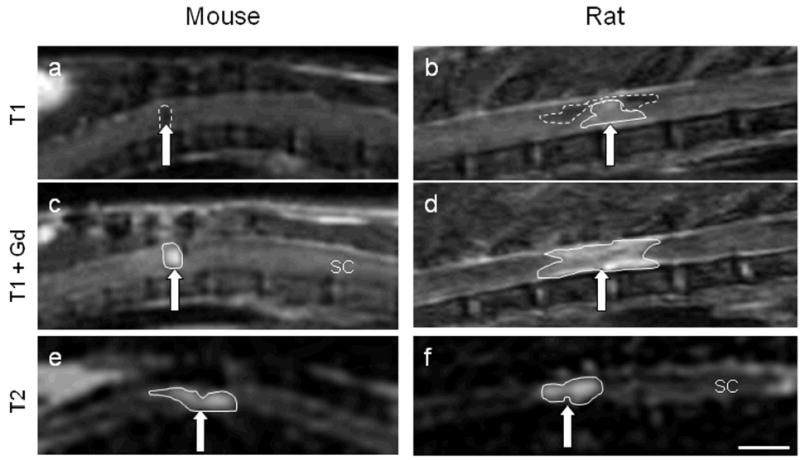
Mouse and rat MRI images at 28 days following a moderate spinal cord injury. Images were taken using a T1W protocol (a, b), T1W protocol with Gd contrast enhancement (c, d) or a T2W protocol (e, f). Brain (B), spinal cord (SC), subcutaneous fat (F), and liver (L) are identified for orientation. SCI lesion (arrows) appears as a hypo-intense region in mice with T1 imaging, a combination of hypo- and hyper-intense in rats, and a hyper-intense region with Gd contrast in both species. With T2W imaging, the hyper-intensity is less contained and demonstrates a larger lesion area in both rats and mice. Hyperintense regions are outlined with a solid line; hypointense regions are outlined with a dashed line. Size bar = A, B, C and D = 0.45cm; E = 0.74cm; F = 0.4cm.