
Figure 2.
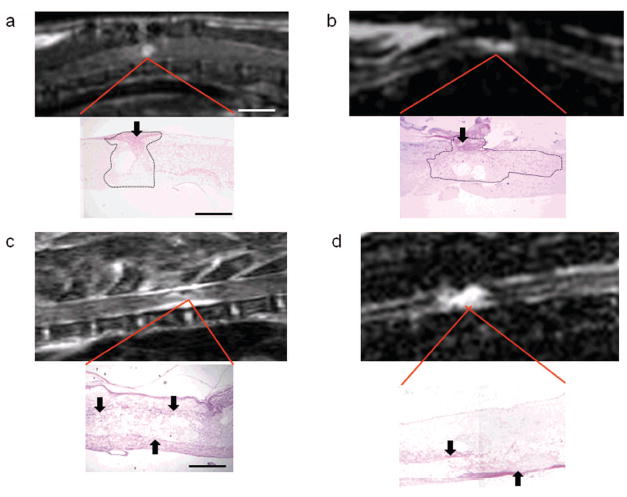
Comparison of mouse and rat MRI and histological images. T1W MRI with Gd enhancement (a, c), or T2W MRI (b, d) were performed at 28 days post-injury in mice (a, b) and rats (c, d). Enlarged region representation in H&E-stained sections provides histological comparisons. In mice, Gd contrast in T1W images indicates an area of increased signal intensity that correlates with a small area of cavitation. However, tissue disorganization and inflammation (dotted line outline) and evidence of scarring (black arrows) are not found in the MRI image. An extended lesion is observed in mice with T2W MRI, as shown by hyper-intensity surrounding an area of hypointensity, which correlates with a small area of cavitation surrounded by disorganized tissue and inflammation in histological samples (dotted line outline). In rats, Gd contrast in T1W images indicates an area of increased signal intensity surrounding a hypo-intense area that correlates with an expanded lesion site (disorganized tissue and cavitation). However, the lesion area in histological sections appears larger than what is seen with MRI. An extended lesion in rats can also be seen with T2W MRI, as seen by hyper-intensity surrounding an area of hypointensity, which correlates with a small area of cavitation surrounded by disorganized tissue and inflammation in histological samples. Size bar (MRI Images): a, c = 0.45cm; b = 0.7cm; d = 1cm. (Histology images): a, b = 0.19 cm; c, d = 0.05cm.