
Figure 7.
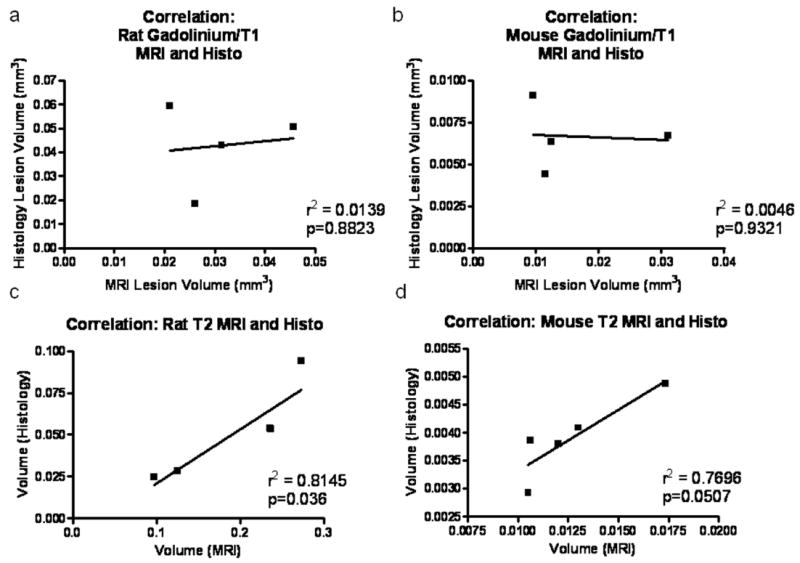
Correlation analysis of MRI and histological quantitation of lesion volume. Correlation analysis was performed on lesion volumes obtained from MRI with Gd contrast (a, b) and T2W MRI (c, d) in rats (a, c) and mice (b, d). N = 4/species for Gd contrast; n = 5/species for T2W MRI.