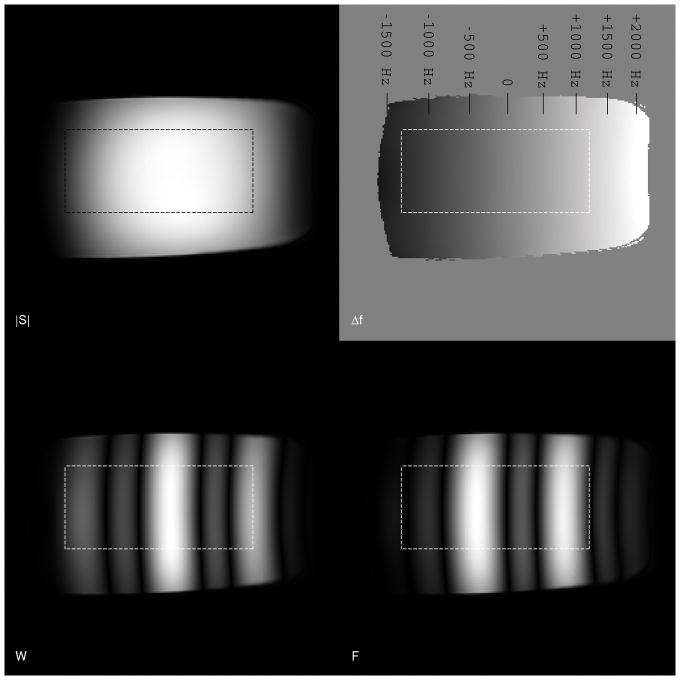
Figure 1.
Experimental results using a deliberate center frequency skew across a phantom show the expected “banded” frequency response in the water and fat images. The phantom is a homogenous cylinder filled with doped water and the center frequency was chosen to vary linearly over a range of 3500 Hz. The magnitude image and estimated field map are shown in the top row, and the decomposed water and fat estimates are below. ROI is shown as a dashed box.

