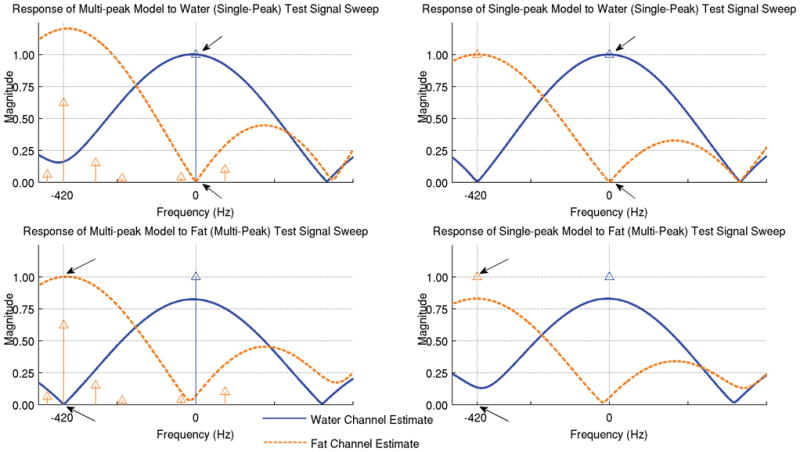
Figure 5.

The same three echoes can be used for water/fat decomposition using a multipeak model that better represents the fat signal. The assumed spectrums for each species are represented by blue (water) and orange (fat) impulses. The water and fat estimates are shown for two input signals using the multi-peak decomposition model at left and using the single-peak model at right. The top plot shows the response to a sweep of a unit water signal (single peak). Note that, at DC, this signal is correctly decomposed into an estimate of 100% water and 0% fat (arrows) using both models. The bottom shows the response to a sweep of a unit fat signal (with its multipeak spectrum) – note that, at −420 Hz, this input is correctly decomposed into 100% fat and 0% water (arrows) with the multi-peak model (left), but incorrectly into a combination of water and fat with the single-peak model (right). Single-peak signal near the nominal fat chemical shift frequency and multi-peak signals near DC properly decomposed, but these situations will only occur in cases of enormous errors in field map estimation (those large enough to result in fat/water swaps).
