
Figure 6.
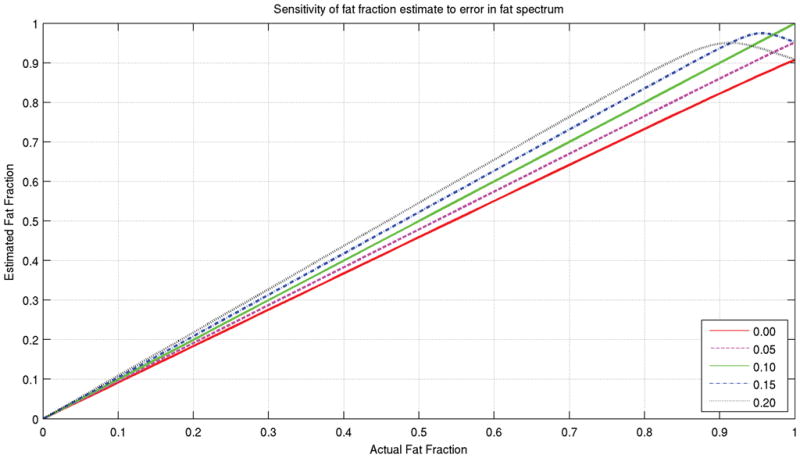
Curves showing the fat fraction estimation accuracy for various mismatches between the decomposition model and input fat spectrum. The input is a combination of water and fat, with the multipeak spectrum used previously. For decomposition, variations of that model are used, with the olefinic (+94 Hz) peak varied from zero to twice its nominal value. Each variation leads to a slight increase or decrease in the fat sensitivity, with the fat fraction curve remaining linear except at fat fractions close to 100%.