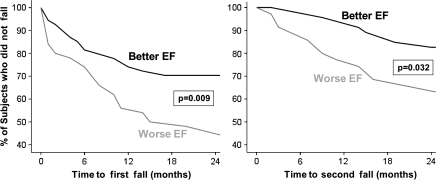
Figure 1.
Survival curves illustrating the percent of participants who did not fall (the y-axes) as a function of time and executive function group. Among the participants who reported no falls in the year prior to baseline, the target cohort, participants with worse EF (lowest quartile) were more likely to fall sooner (left) and more likely to become multifallers sooner (right) compared to those with better EF (best quartile). Put differently, participants with worse EF were more likely to become fallers and recurrent fallers sooner than those with better EF. EF = executive function.

