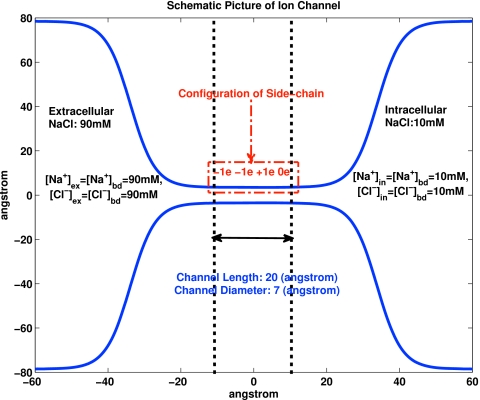
Figure 5.
The setup for the calculations of time dependent current shown in Fig. 4. The blue line shows the boundary of the one dimensional channel. The steep spread between the lines is a one dimensional representation of the baths used because it reduces the “resistance” to current flow or flux. That is to say, the greater cross sectional area to flow allows more flow for a given gradient of electrochemical potential than in the narrow 7 Å (diameter) channel through the bilayer itself. The dashed line represents the lipid bilayer membrane. The distribution of fixed charge along the channel wall is labeled “configuration of side chains.” The concentration of salts is shown in the baths. The units of the axes are divided by angstroms.

