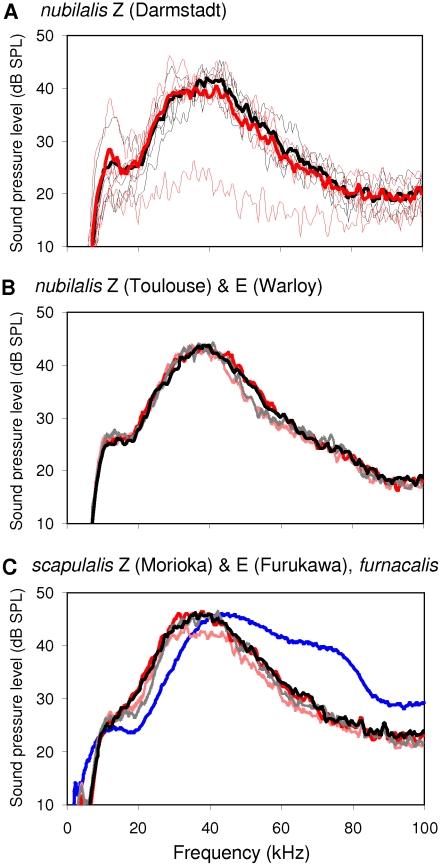
Figure 4. The frequency–sound pressure level distribution of pulses in O. nubilalis, O. scapulalis, and O. furnacalis.
Black lines are spectra of pulse 1 (P1), and red lines are those of pulse 2 (P2). A) Thin lines are individual spectra of P1 and P2, and thick lines are the mean spectra of P1 and P2 in Z-type O. nubilalis (Darmstadt, n = 5). One spectrum with low peak level of P2 differed from all others, and might be a noise. B) Solid lines are the mean spectra of P1 and P2 in Z-type O. nubilalis (Toulouse, n = 9), and dotted lines are the mean spectra of P1 and P2 in E-type O. nubilalis (Warloy, n = 5). C) Solid lines are the mean spectra of P1 and P2 in Z-type O. scapulalis (Morioka, n = 7), and dotted lines are the mean spectra of P1 and P2 in E-type O. scapulalis (Furukawa, n = 7). The blue line is the mean spectrum of O. furnacalis (n = 5) obtained from Nakano et al. (2008) [7]. See Table 1 for collection sites of the populations examined.

