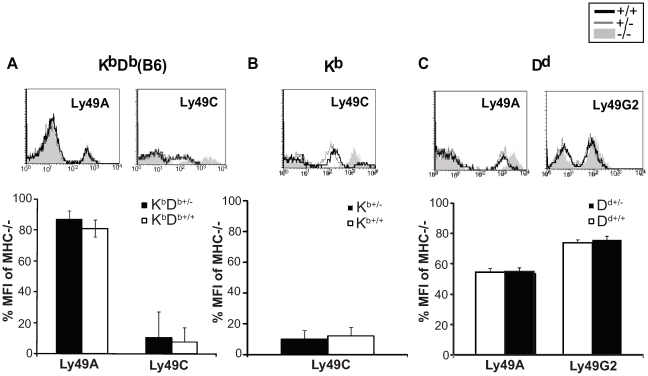
Figure 4. Ly49 expression levels in MHC class I hemizygote and homozygote mice.
Ly49 expression on NK1.1+CD3− cells in A) KbDb, B) Kb and C) Dd mice. Filled grey histograms represent expression in MHC class I-deficient mice, black thick line expression in homozygous mice and grey line in hemizygous mice. Data represents one out of two experiments performed. The bar graphs show expression level of Ly49A, -C, or –G2 presented as % of median fluorescence intensity compared to MHC−/− mice, gated on the positive population for each receptor. Data are the means of a total of 4 mice in each group. Error bars show standard deviation.

