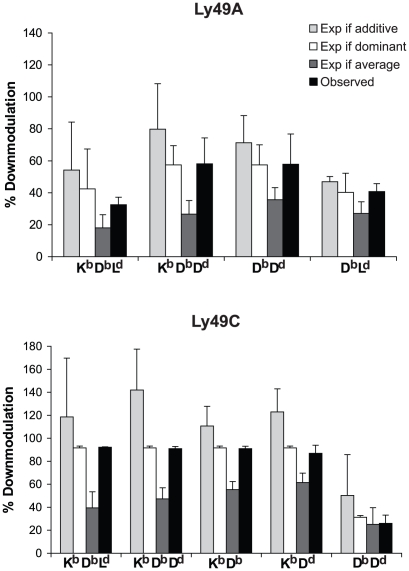
Figure 5. Modeling of the effect of having multiple MHC class I ligands on Ly49 downmodulation.
Degree of Ly49A and -C downmodulation in mice expressing more than one MHC class I, and different models for their combined downmodulating effect. The “observed” levels were measured on freshly isolated NK1.1+ CD3− splenocytes. The expression is shown as Downmodulation Index (DMI), which means % reduction of median fluorescence intensity compared to the MHC−/− mouse. Values are averages of 3–7 experiments. The modeled values show expected DMI if the downmodulating effect of the MHC class I molecules were additive, dominant, or averaged. See Material and Methods for calculations. Error bars show standard deviations.

