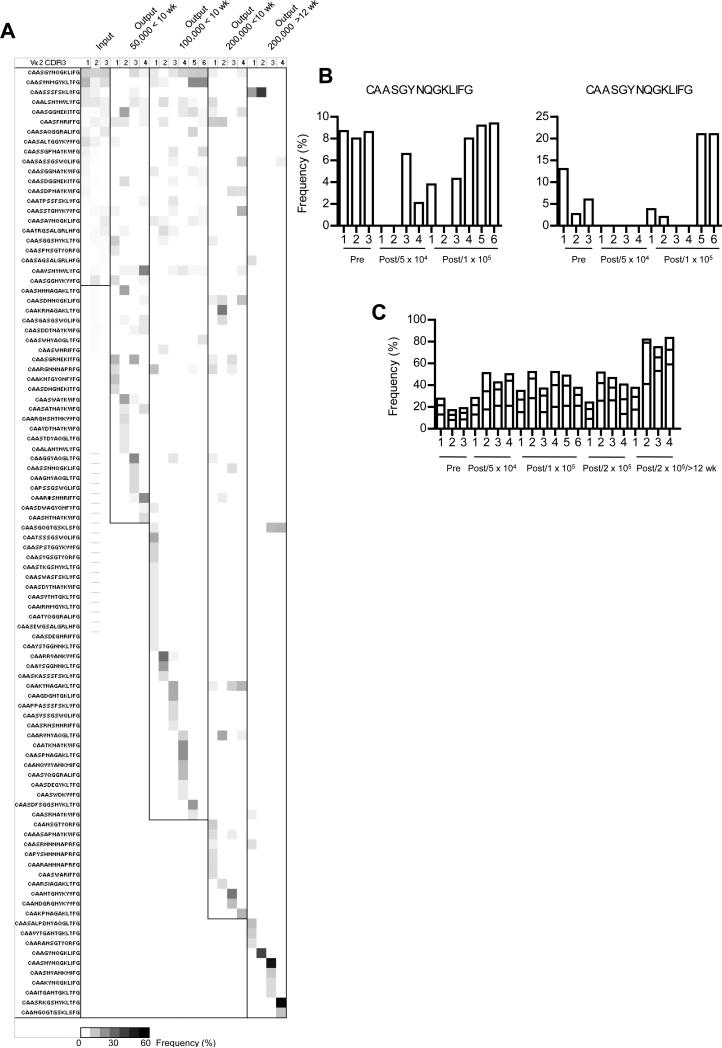
Fig. 7. Frequency of Vα2 CDR3 sequences associated with pre- and post-transferred TCRβ Tg+ Treg cells.
(A) All unique sequences in the Vα2 data set expressed at a frequency ≥4% in any pre-transferred sample (input) or any individual recipient post-transferred (output) were identified. The prevalence of these sequences were compared to each other and represented as a heat map. (B) The frequency distribution of the two most prevalent sequences in the pre-transferred Treg cells in relationship to matched output post-transferred Treg cells. (C) Frequency of the 3 most prevalent sequences within individual samples of pre- and post-transferred Treg cells.

