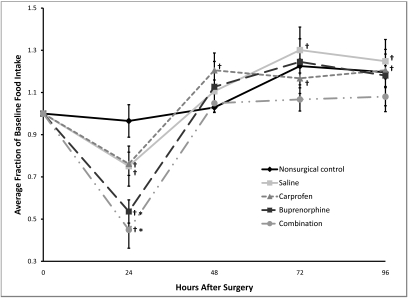
Figure 2.
Postoperative changes in food intake. Baseline values are represented as 1.0, and subsequent values are given as a change relative to baseline values. Each point represents the mean ± SE. *, P < 0.01 compared with value for nonsurgical control group at the same time point. †, P < 0.03 compared with baseline.

