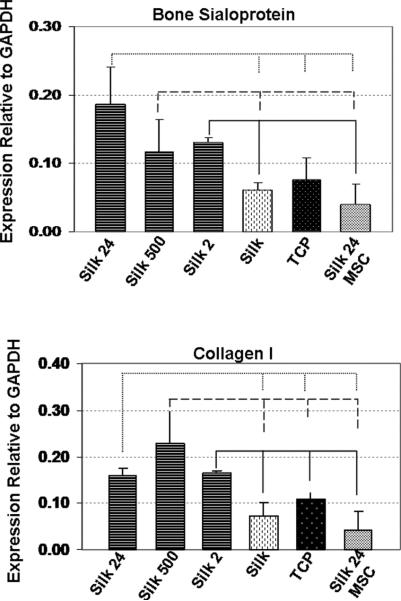
Figure 3.
Osteogenic gene expression of cells grown on silk/silica films (Silk 24, Silk 500, and Silk 2) or silk only (Silk) and tissue culture plastic (TCP) after exposure to osteogenic stimulants for 10 weeks as compared to cells in control medium (Silk 24 MSC). Each column represents the mean and standard deviation of N = 3 independent cultures. P<0.05.

