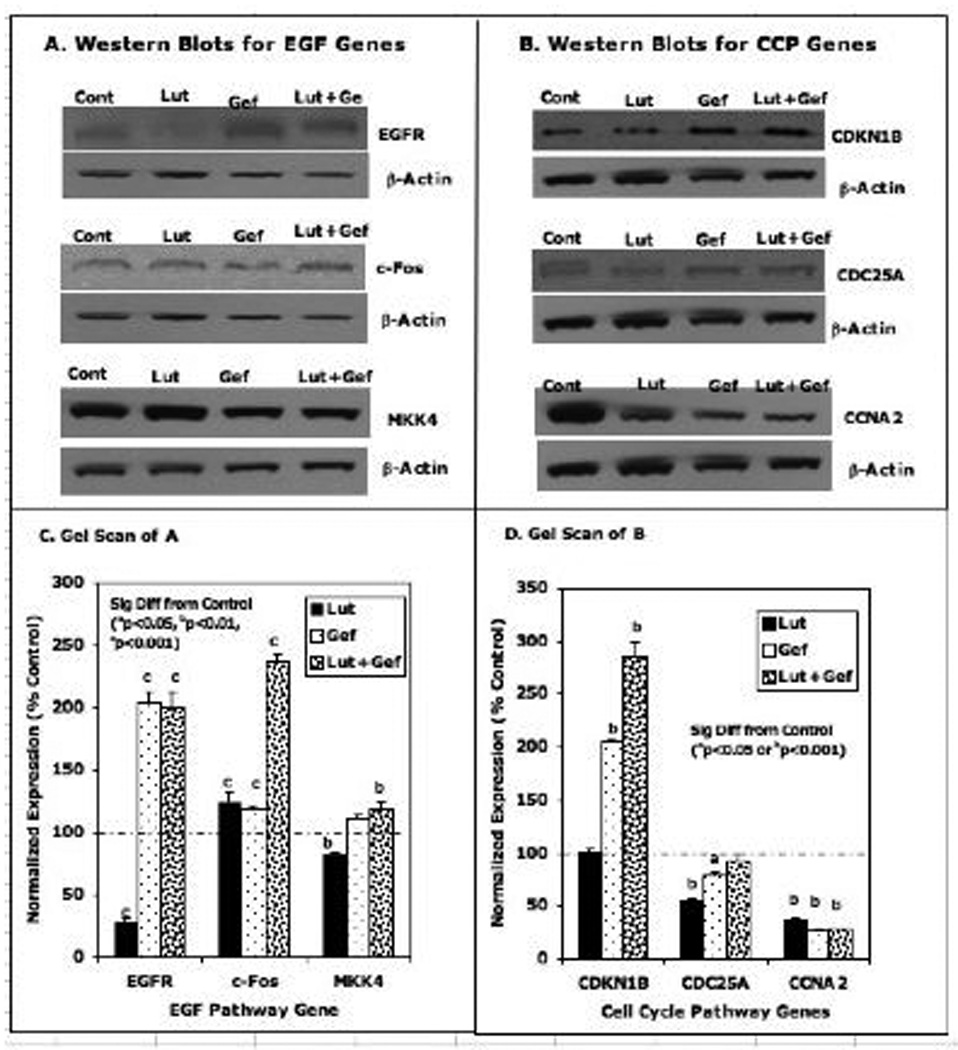
Figure 9. Western Blot Analysis of Selected EGFSP and CCP Genes Treated with the High Doses of Luteolin and/or Gefitinib.

PC-3 cells were treated with the high doses of luteolin (35 µM) or gefitinib (44 µM) alone or in combination as described in Figure 5. Twenty-four hours following treatment, the protein extracted from luteolin and/or gefitinib treated cells and EtOH controls was subjected to western blot analysis with antibodies for EGFSP Genes (Panel A) or CCP Genes (Panel B). Bands were also analyzed by UN-SCAN-IT gel to determine band intensity, normalized to β-actin and graphed according to the change in fold expression as a percent of the EtOH control that represented 100%. Data for Panel C are the scans for the EGF Genes (Panel A) and Panel C contains the scans for the CCP genes (Panel B).
